3,300Trades
48%Win rate
-0.66%Avg per trade
-1.44%Vs S&P 500
0.89Profit factor
0 of 32Variants profitable
Post-earnings-announcement drift is one of the most robust findings in empirical finance. When a firm surprises the market, its share price tends to keep moving in the direction of the surprise for weeks, as if investors take time to absorb the news. A popular retail version of the idea skips the earnings calendar altogether: if a stock opens sharply higher on several times its normal volume, something has happened, so buy it and ride the drift. This page tests that rule on every American common stock since 2021.
It does not work. Bought at the next morning’s open and held for three weeks, these stocks lost an average of 0.66% a trade after costs, and trailed the S&P 500 by 1.4%. None of the 32 variants tested made money. The most useful finding is not the result but a data trap uncovered along the way, which any backtest built on split-adjusted prices can fall into.
The full testing method is set out in how the strategies are tested. Each trade is £500, with Interactive Brokers’ tiered commission and a modelled bid-ask spread of 3 to 15 basis points a side, depending on liquidity. The test runs from September 2021 to December 2025. Data for 2026 were set aside before any testing as an out-of-sample check. Because no version of the rule was worth checking, they have not been used.
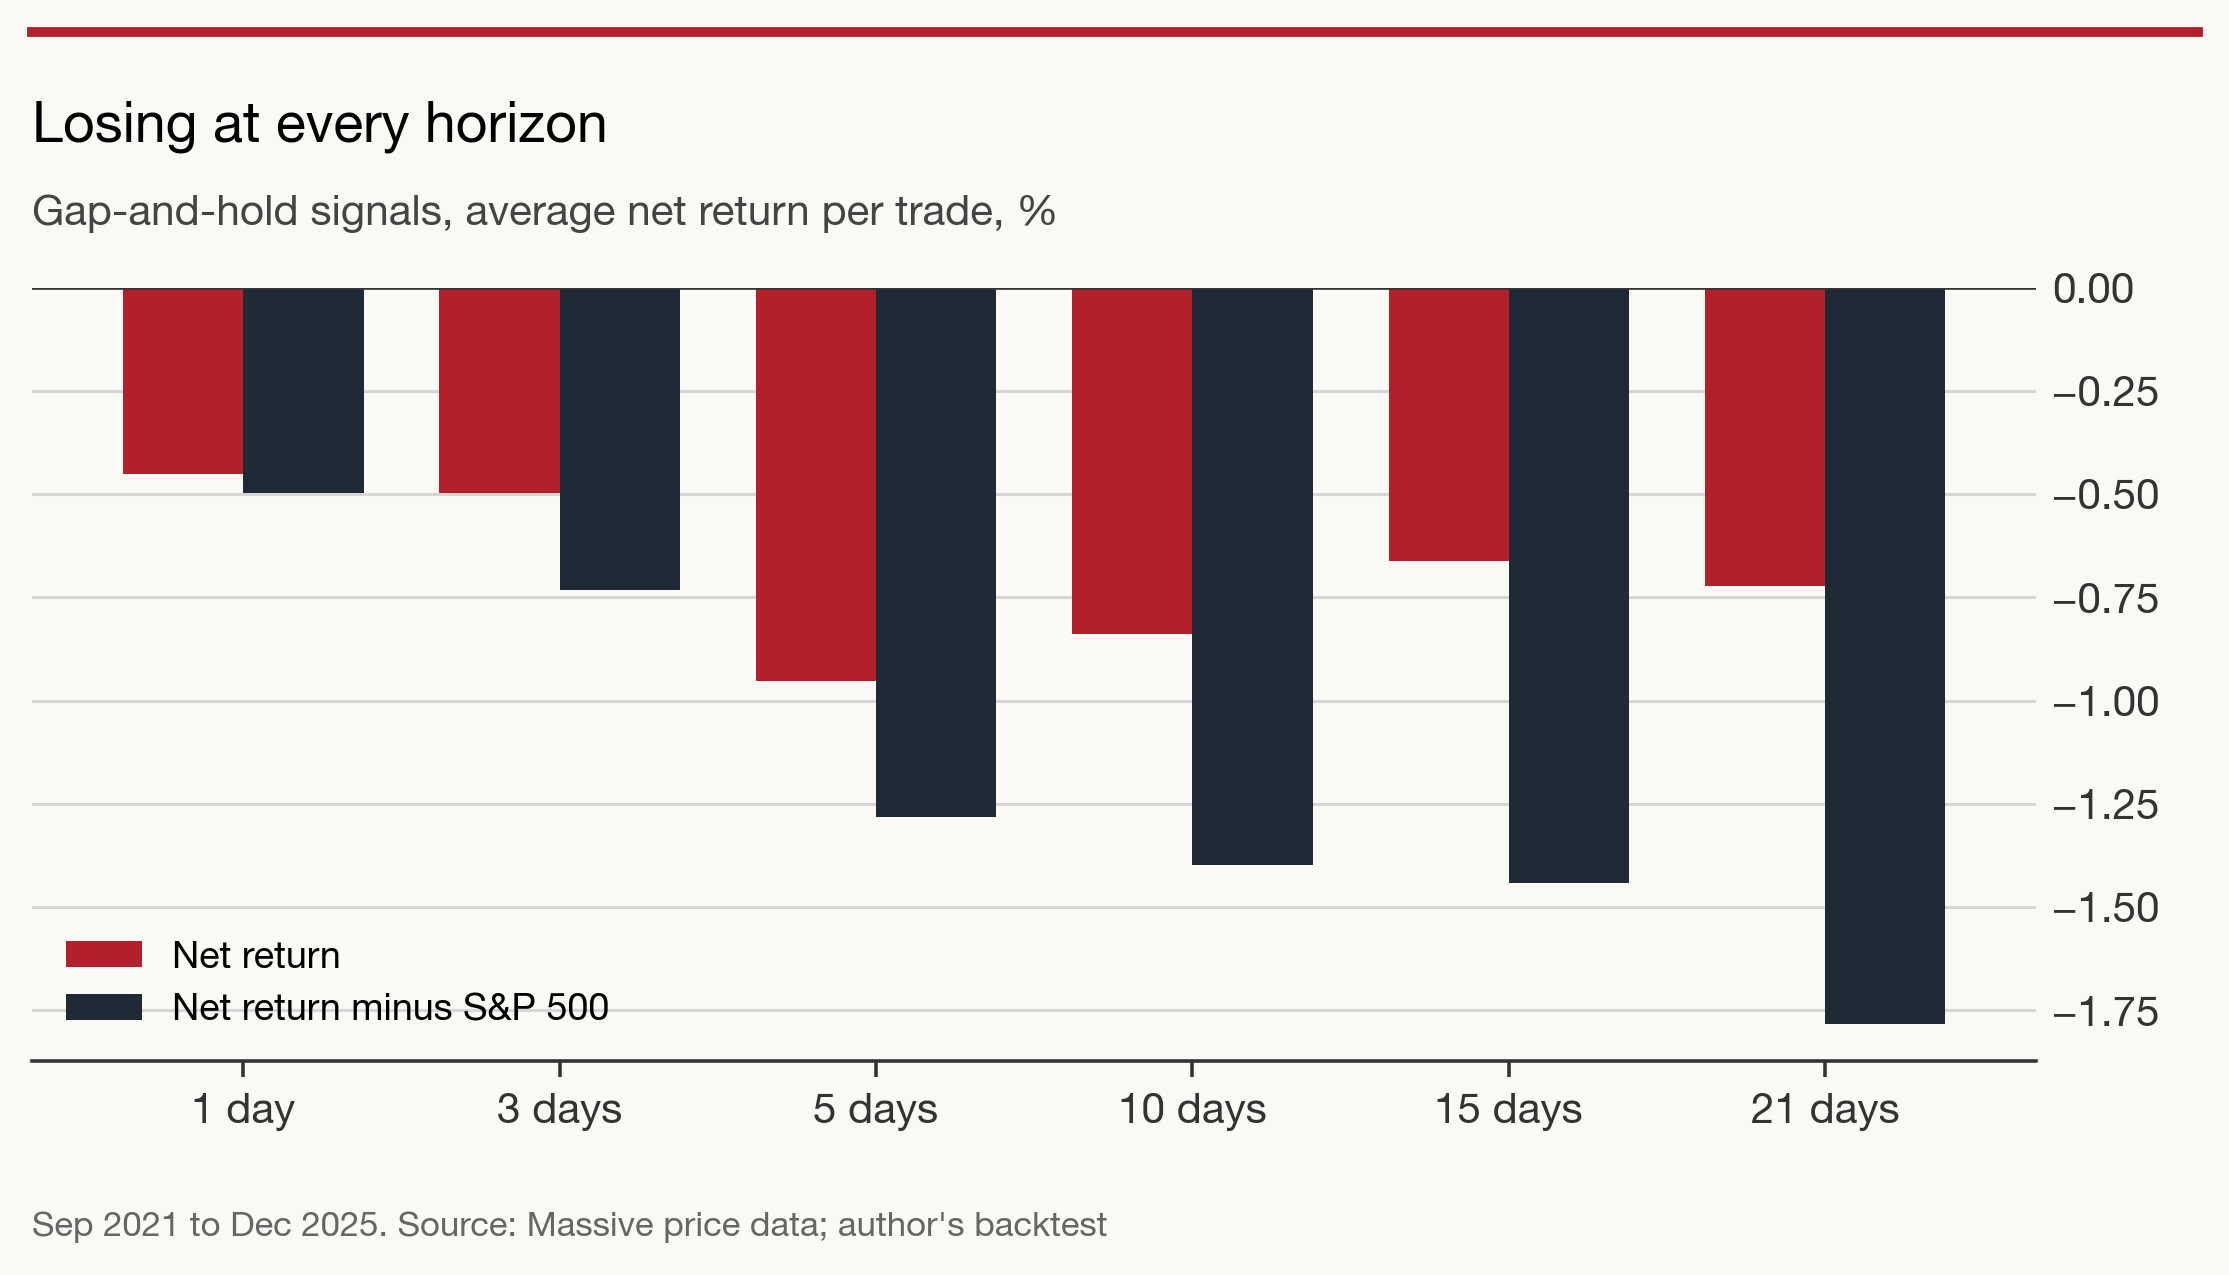
The shape is unambiguous. The signal loses money the next day, loses more over a week and falls further behind the market the longer it is held. Costs are not the problem: before commission and spread, the three-week trade still averaged −0.40%. Over these four years, a share that gapped up on heavy volume was, on average, a share about to give some of it back.
| Hold | Trades | Win rate | Gross | Net | Vs S&P 500 | t-stat |
|---|---|---|---|---|---|---|
| 1 day | 3,415 | 44% | -0.19% | -0.45% | -0.50% | -4.4 |
| 3 days | 3,372 | 47% | -0.23% | -0.50% | -0.73% | -3.1 |
| 5 days | 3,357 | 46% | -0.69% | -0.95% | -1.28% | -4.8 |
| 10 days | 3,325 | 47% | -0.57% | -0.84% | -1.40% | -3.3 |
| 15 days | 3,300 | 48% | -0.40% | -0.66% | -1.44% | -2.2 |
| 21 days | 3,274 | 48% | -0.46% | -0.72% | -1.78% | -2 |
The intuition behind the trade is that bigger volume means bigger news and a longer drift. The data say the opposite. Gaps on three to five times normal volume roughly broke even; those on ten times or more lost almost 3% a trade. The only groups close to zero were the largest, most liquid shares, the ones where a gap is most likely to reflect genuine news rather than a squeeze.
| 15-day hold | Trades | Avg return | Vs S&P 500 | Win rate |
|---|---|---|---|---|
| Volume 3–5× | 1,904 | -0.09% | -0.97% | 50% |
| Volume 5–10× | 1,035 | -0.92% | -1.61% | 47% |
| Volume 10×+ | 361 | -2.92% | -3.45% | 42% |
| Turnover <$20m | 1,261 | -0.98% | -1.76% | 47% |
| Turnover $20–100m | 1,270 | -0.82% | -1.70% | 46% |
| Turnover $100m+ | 769 | +0.12% | -0.50% | 52% |
| Gap 5–10% | 1,772 | -0.37% | -1.08% | 49% |
| Gap 10–20% | 1,148 | -1.48% | -2.32% | 46% |
| Gap 20%+ | 380 | +0.45% | -0.47% | 51% |
Nor did the “held the gap” filter rescue anything. Gaps that faded during the first day did worse (−1.33% a trade), so the filter helps a little, but only by making a losing trade lose less.
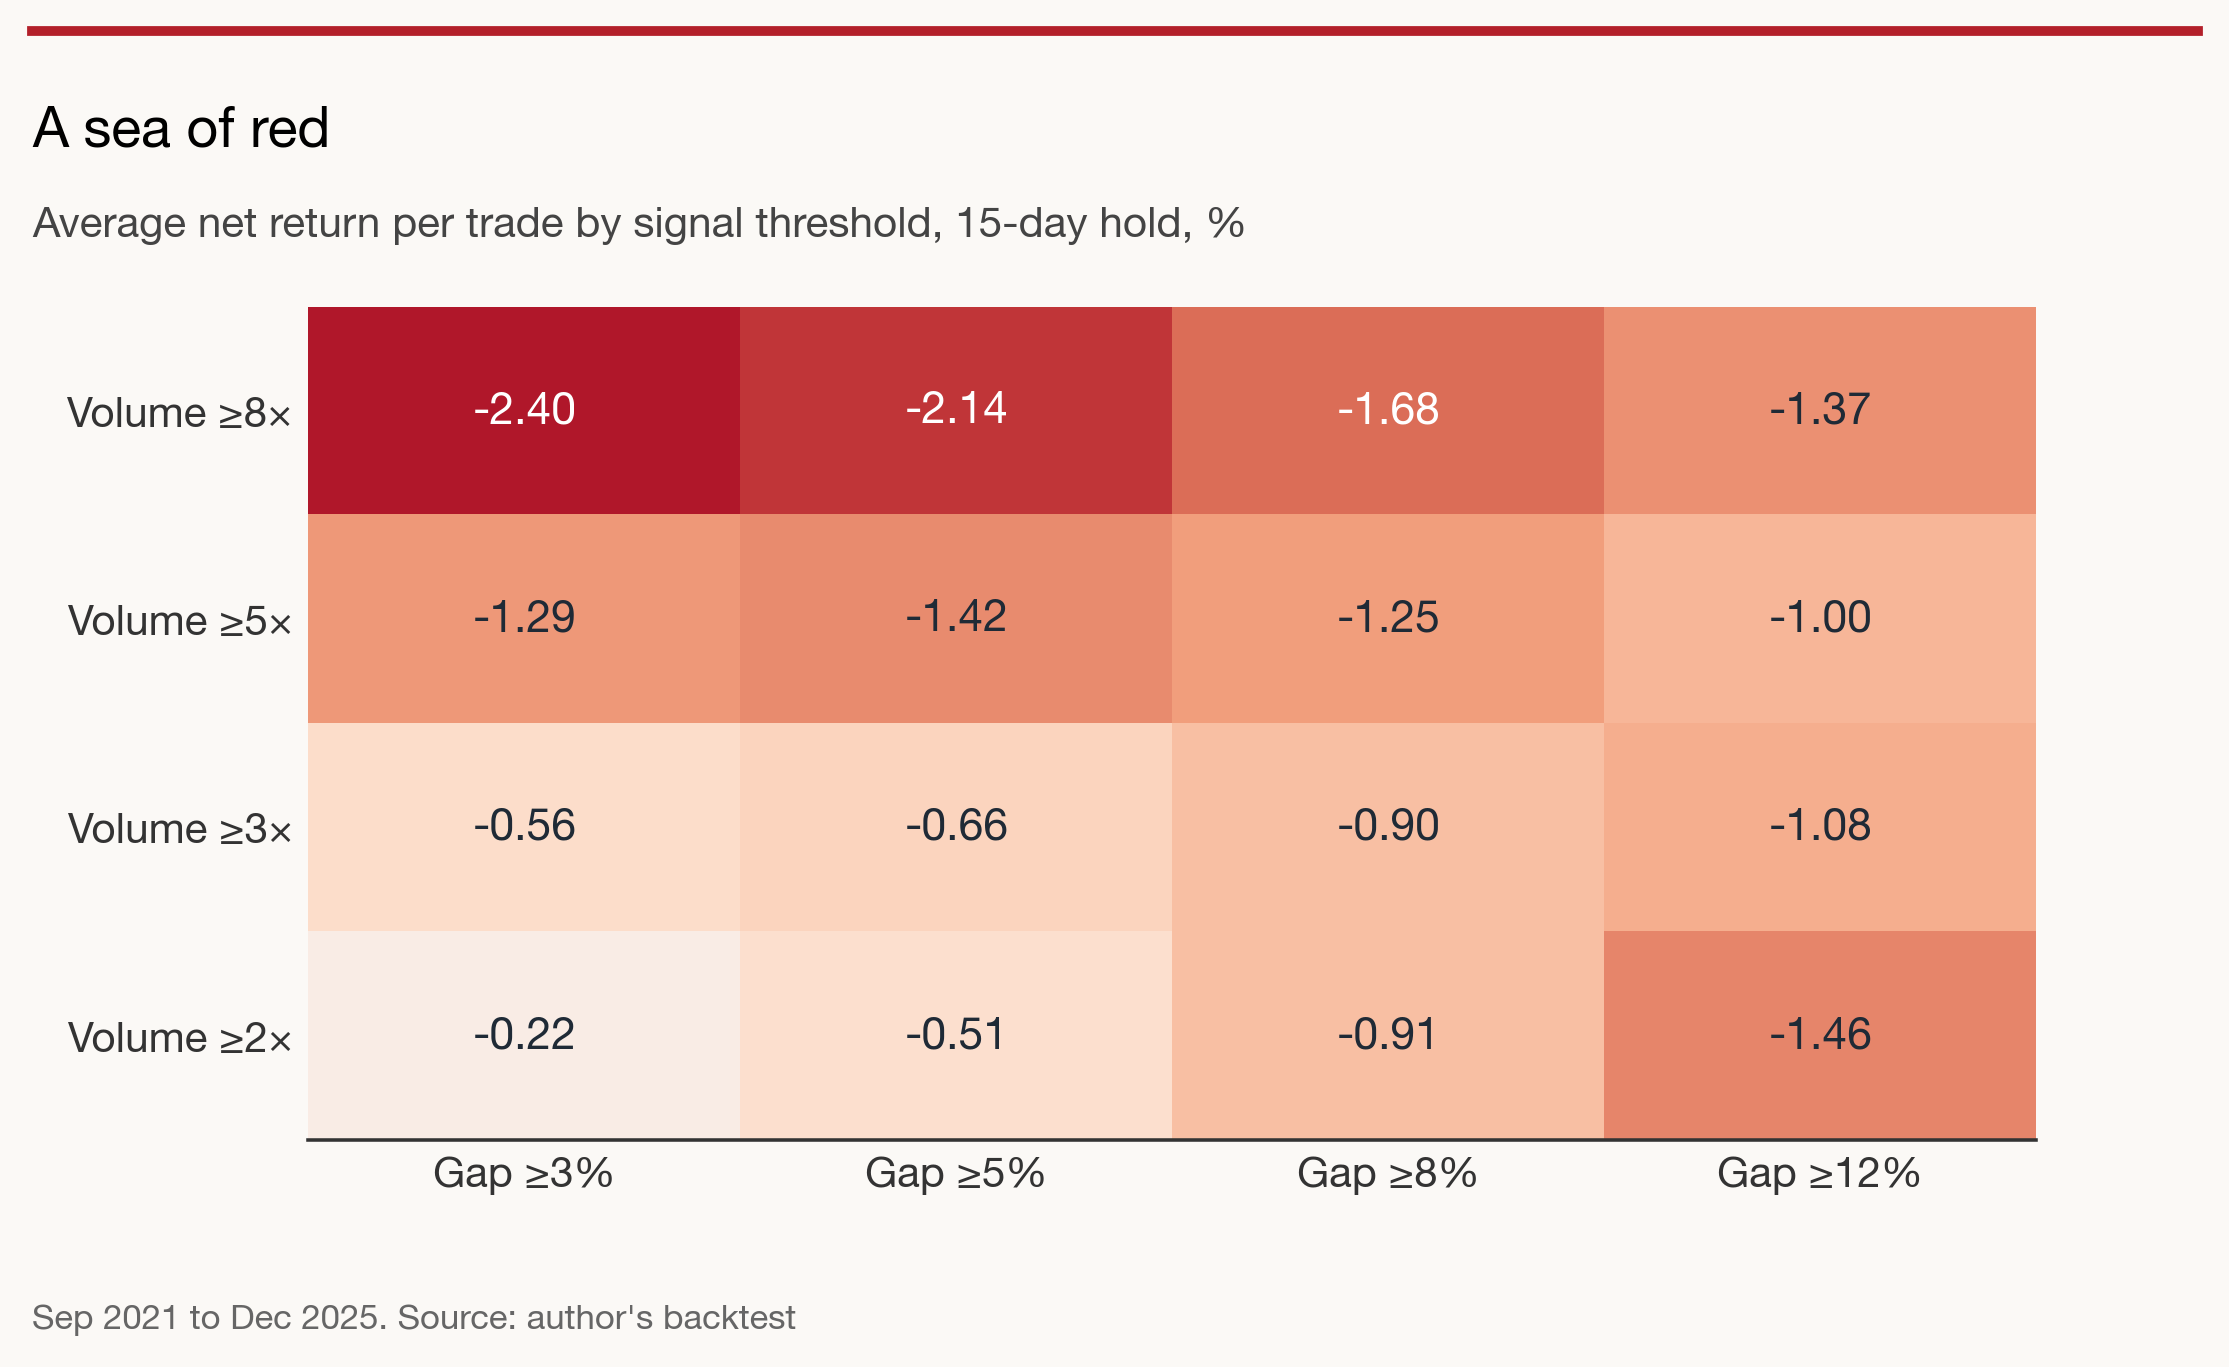
Sixteen combinations of gap size and volume threshold were tested at both a three-day and a fifteen-day hold. All 32 lost money after costs, and none beat the S&P 500. When every neighbouring setting points the same way, the result is not a fluke of one parameter.
The first run of this backtest was far worse: −2.82% a trade, with some positions losing 95% in three weeks. The code was correct, and the prices matched the data vendor to the cent. The problem was the filter.
Historical price data are usually split-adjusted: when a company does a 1-for-10 reverse split, every past price is multiplied by ten so the chart stays continuous. That is right for measuring returns, but wrong for anything that depends on the price level at the time. A stock trading at $0.40 that later does a 1-for-1,000 reverse split appears in the history as a $400 stock. A filter of “price at least $5” lets it straight through.
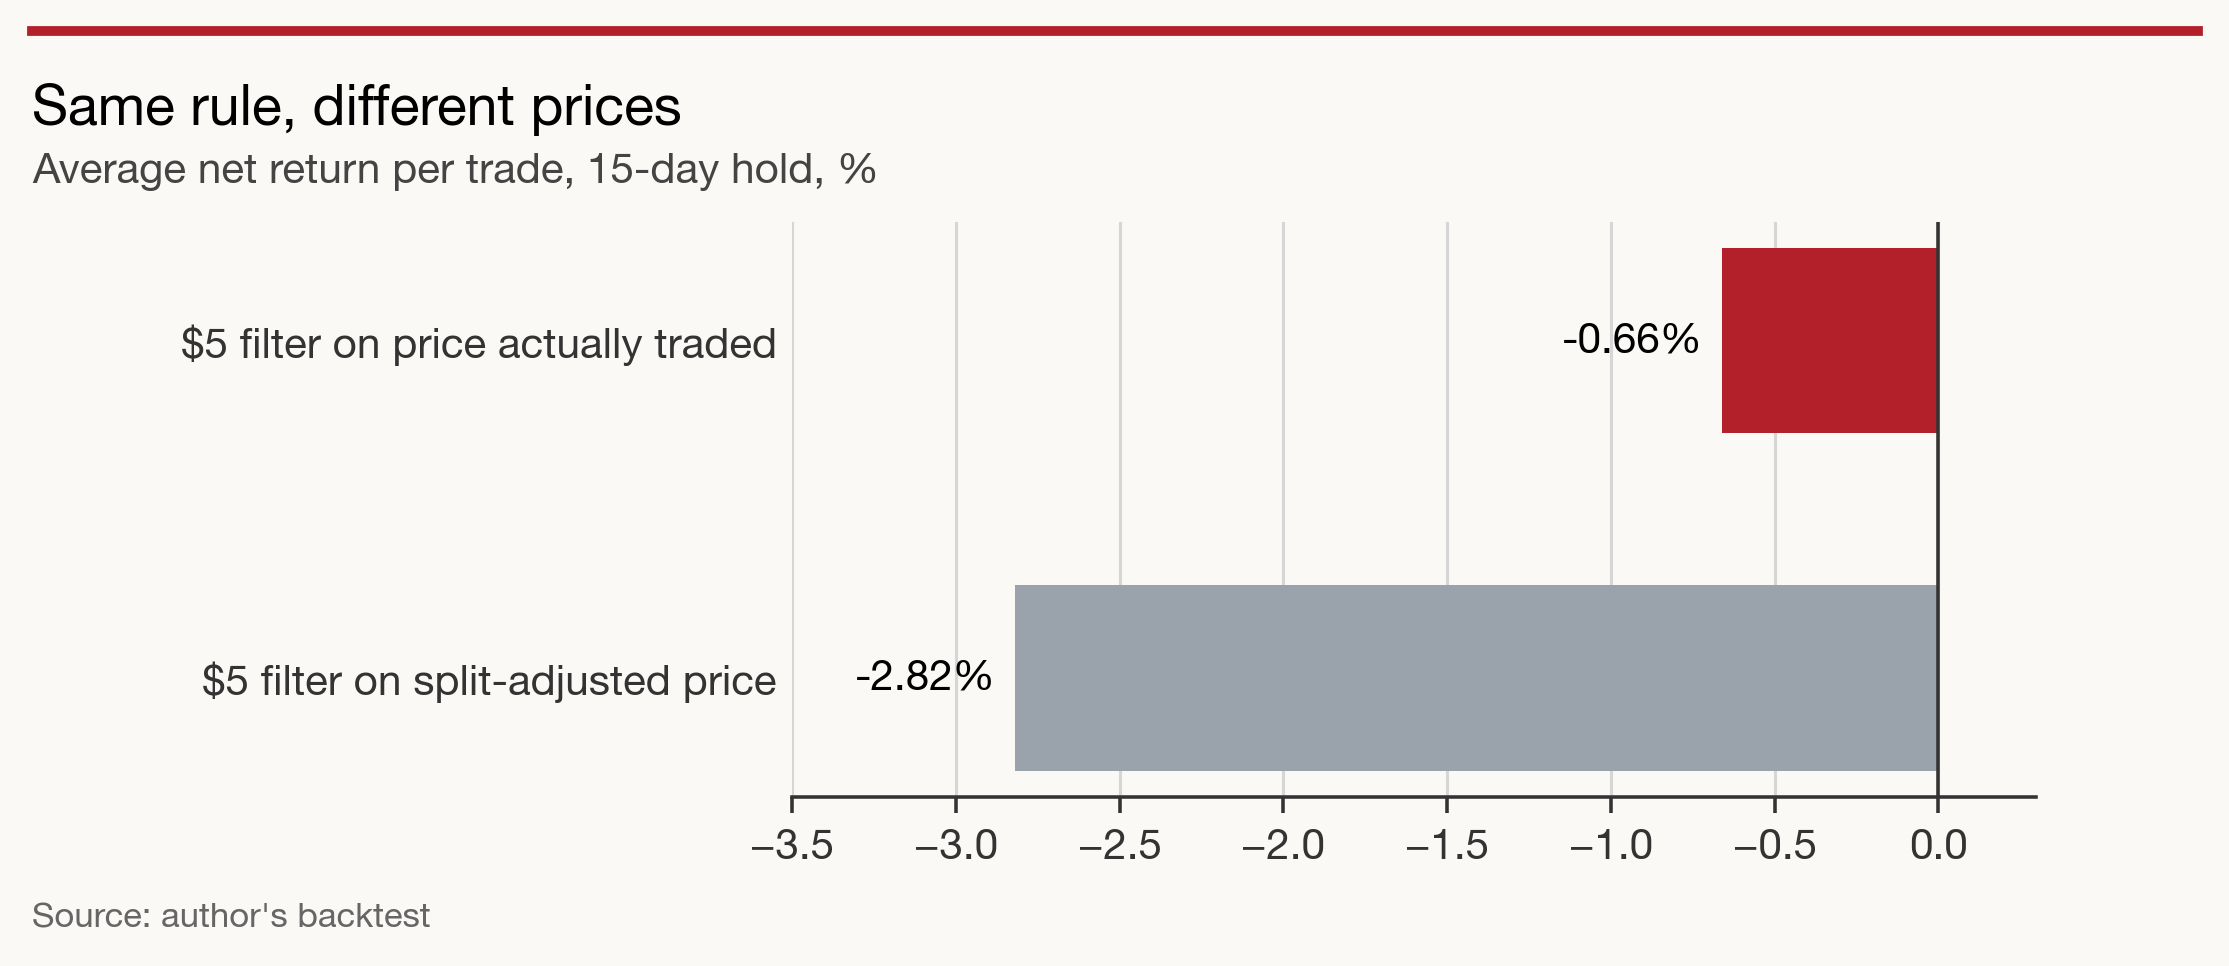
The worst offenders were serial reverse-splitters: one Nasdaq micro-cap did five reverse splits between 2023 and 2026, compounding to roughly 1-for-6.75m, and showed up at an adjusted “entry price” of $429,750. These are exactly the shares a $5 filter exists to exclude, and they are also the shares most likely to gap up on enormous volume and then collapse. The bias is look-ahead in disguise: today’s share count is leaking into yesterday’s filter.
The fix is to undo the adjustment, multiplying each historical price by the split ratios of every split that happened after that date:
def raw_price(sig, adj_px, splits):
    """The price the stock actually traded at on signal_date."""
    m = sig[["ticker", "signal_date"]].reset_index().merge(splits, on="ticker")
    m = m[m["execution_date"] > m["signal_date"]]          # only splits still to come
    factor = (m["split_to"] / m["split_from"]).groupby(m["index"]).prod()
    return adj_px * factor.reindex(sig.index, fill_value=1.0)
That single change removed 423 signals and cut the loss by three-quarters. The same check applies to any absolute-price rule: minimum prices, penny-stock exclusions, price-based position sizing or “under $10” universes. Market-value filters are safe only if shares outstanding come from the same date as the price.
Three explanations fit the data, and they are not exclusive.
The spread is modelled, not measured, but costs are not what sinks this rule. The data lack intraday highs and lows, so “held the gap” means closing above the open, a looser test than closing near the high. The test covers just over four years, dominated by a post-2022 market that rewarded large technology firms over the small and mid-sized companies that make up most gap signals. A version keyed on actual earnings surprises, using consensus estimates, might well behave differently; this one is not that.
The conclusion is narrow but firm. Buying shares that gap up on heavy volume, without knowing why they gapped, has not been a profitable trade since 2021.
Hypothetical backtest, September 2021 to December 2025. Prices from Massive (formerly Polygon.io) daily grouped bars; split history and delisted tickers from Massive reference data. Not investment advice. Past performance is not a reliable guide to future results. See the disclaimer.